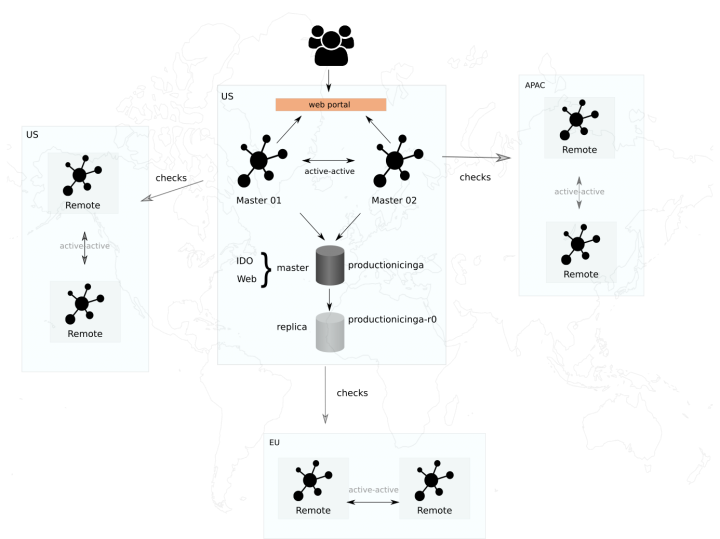
Here after some information provide by Citrix on the XenMobile Service (cloud) Monitoring Architecture used:
As stated, the solution is based on a system called Icinga2, a distributed, highly-available application that allows you to run business decisions based on the result of invoking checks or probes against another networked service, like XenMobile in this case
In this post,it will dig a bit deeper and illustrate the physical layout of the system in the cloud. Let’s begin by showing a (stripped down) deployment architecture and then we’ll break it down into its main parts:

Icinga can be configured to be distributed. In this case, we’re hosting two Icinga Masterinstances (center) for high-availability. These instances are in charge of discovering or enumerating our cloud customer base resources as well as our external/internal microservices. The masters also expose a web interface which acts as the portal that our CloudOps engineers use to visualize the status of every single one of our 14,000+ checks. The masters work in an “active-active” High Availability mode, which means that both are actually performing the same jobs and either one can either execute local check commands or delegate remote commands onto the Remote Icinga instances, also called satellites. Let’s segue into those.
In order to reduce the load on the master instances, Icinga can be configured to perform checks on remote Icinga systems. These remote instances are set up with their own installation of Icinga but take on different configurations. In addition, none of the remotes performs any auto-discovery–the process of enumerating our environment to see what needs monitoring. The remote endpoints are only tasked with executing commands remotely against a specific part of a customer’s installation (e.g. LDAP, VM status, SSL Certificates, etc) and reporting that result back to the masters. Remotes can also be set up in a cluster for high availability so that any one of them can act and execute remote commands. Citrix have made the regions with most abundant customer presence clustered this way using an “active-active” scheme.
So, on a basic level that’s how the distributed monitoring system is spread out. In an upcoming post, it will continue peeling off layers and show you exactly how we perform checks against a customer’s environment and what types of probes we execute periodically to ensure that Citrix CloudOps engineers can proactively debug/troubleshoot issues before the customer is impacted.