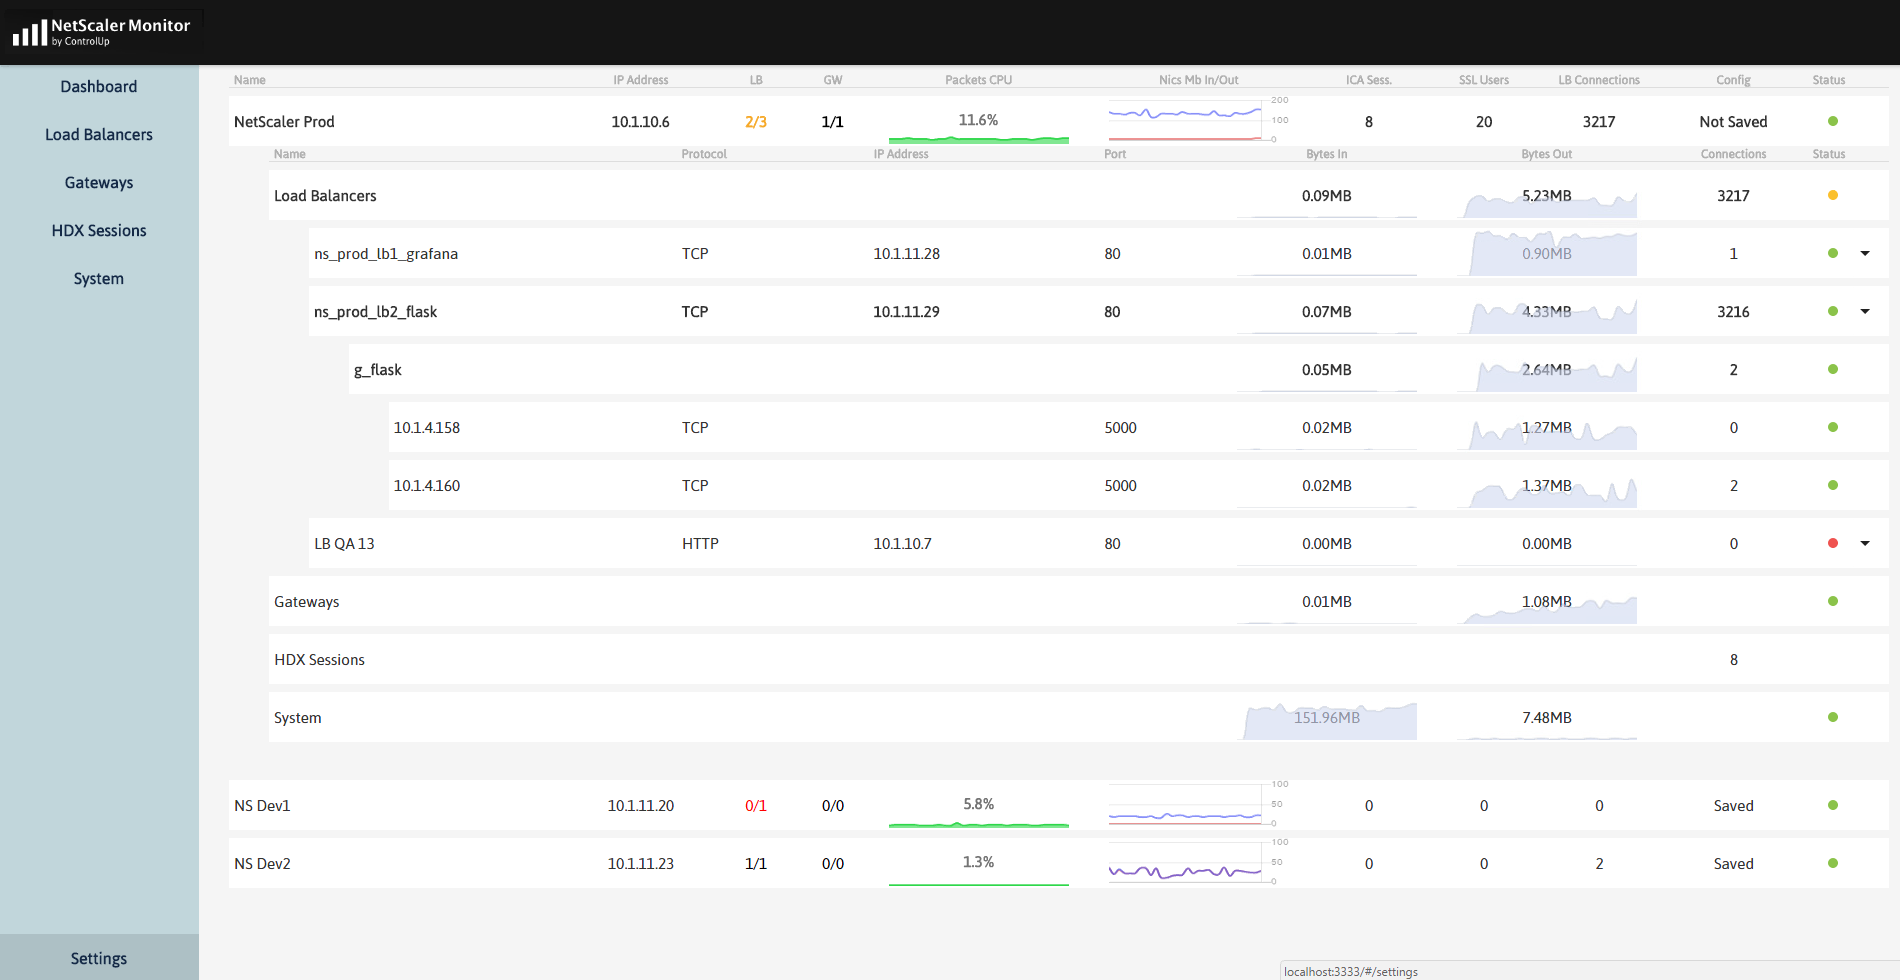
Control UP has released a free tool to monitor your NetScaler.
I saw a demo of this Tool in Orlando at the Citrix Synergy during a Control UP Meetup, it’s free and powerful so I can only tell you one thing: Go and try it!
The NetScaler Monitor allows you to see the real time status of your Load balancers, gateways, HDX sessions running through your NetScalers (with system information and resource usage data displayed as well).
See a short video demonstrating the Netscaler Monitor in action.
Let’s say a few words about what’s under the hood:
The NetScaler Monitor is a service which is divided into two separate components. The first component reads the NetScalers data (at 3 second intervals by default, configurable) and the second component is self-contained web service which shows the collected data.
In fact, you can run the NetScaler Monitor on any computer or server in your network and provide access to anyone from a central location.
We put a lot of effort into making things as easy and simple as possible and to allow you to get to the information in the most convenient way. But I’m sure more can be done to make things simpler – and more enjoyable.
We want your opinion! Please send us as much feedback as you can. Together we’ll make NetScaler monitoring great again.
The Netscaler Monitor is Free – take it for a test drive today! Download here.
After sucesful installation, open Chrome or Firefox and browse to http://localhost:3333

Click on Settings

Click on the + Sign to add a NetScaler

Provide the following information:
- NetScaler Name (Friendly Name)
- NetScaler Host (NetScaler IP or FQDN)
- NetScaler Username (ex: nsroot)
- NetScaler Password for NS Username
Click on Add NetScaler

Click on Dashboard to monitor your NetScaler
